![HouseOf Quality.net (18)[1].png](https://static.wixstatic.com/media/72c1e3_be647acd1ed04c5db567c2601cc2723e~mv2.png/v1/fill/w_264,h_164,al_c,q_85,usm_0.66_1.00_0.01,enc_avif,quality_auto/HouseOf%20Quality_net%20(18)%5B1%5D.png)
In God we trust, rest bring data, Insights are a must, no room for theta!
- HouseOfQuality.net
- Nov 23, 2024
- 6 min read
Updated: Dec 4, 2024
"In God we trust, all others bring data" - W. Edwards Deming
This famous quote captures a powerful truth, that decision-making thrives on evidence, not just intuition or belief. While faith has its place, real-world challenges demand the clarity and accountability that only data can provide.
This perspective reshapes the way we approach problems, urging us to prioritize measurable insights over subjective assumptions. History is full of lessons, showing us both the immense value of leveraging data for decision-making and the costly consequences of disregarding it. These article serve as reminders of the stakes involved in embracing—or ignoring—data.

How Amazon Used Data to Deliver the Future of E-Commerce
In the early 2010s, Amazon faced a pivotal moment in its journey as the e-commerce giant we know today. Competition was heating up, with platforms like Walmart stepping up their game by offering faster delivery options. Customers, spoiled by the growing convenience of online shopping, began expecting same-day or next-day delivery as the norm rather than a luxury. Traditional logistics couldn’t keep up—orders were processed only after customers clicked “buy,” leading to inevitable delays. Amazon knew it couldn’t afford to fall behind. The challenge was clear: speed up deliveries while keeping costs under control, all without compromising the customer experience that was central to its brand.

This wasn’t just about shaving a few hours off delivery times; it was about rethinking how logistics worked. Amazon needed to figure out a way to predict what customers wanted before they even placed an order. That meant analyzing vast amounts of data to anticipate demand, optimizing where products were stored, and cutting shipping costs by avoiding last-minute air transport. It was a monumental task that required innovation on multiple fronts—data, technology, and operations.
Amazon’s solution was nothing short of groundbreaking. The idea was simple yet bold—anticipatory shipping— ship products closer to customers before they ordered them.
But this wasn’t a haphazard gamble; it was a data-driven strategy that leaned on the power of predictive analytics. Amazon began collecting and analyzing an extraordinary amount of data. Every click, every search, and every item left in a cart told a story about what customers wanted. Purchase histories, browsing behavior, wish lists, seasonal trends, and even demographic details like location and preferences were fed into advanced machine-learning algorithms. These algorithms weren’t just crunching numbers; they were assigning likelihood scores to customers, predicting what they were likely to buy next.
To further refine its logistics strategy, Amazon conducted a regional analysis of cart abandonment and purchase likelihood rates across its customer base. Using aggregated data from its regions, Amazon identified clear patterns.
Hypothesis 1
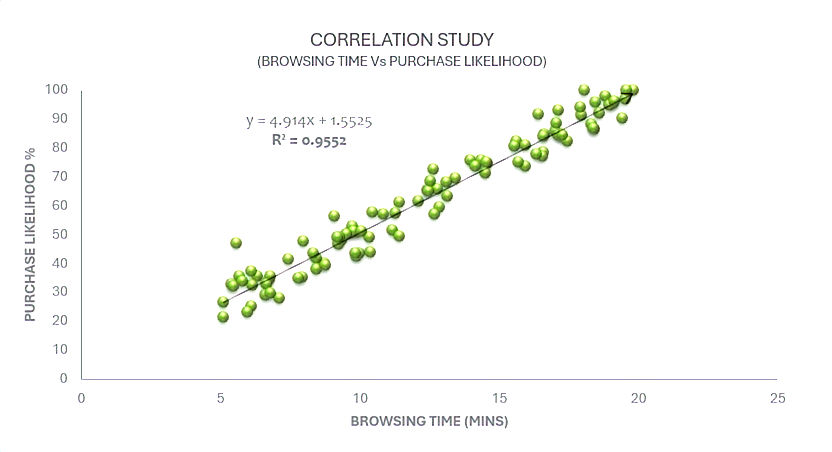
Null Hypothesis (H₀) is no significant relationship between browsing time and purchase likelihood. The Alternative Hypothesis (H₁) is a strong positive relationship between browsing time and purchase likelihood, suggesting that longer browsing sessions are linked to higher chances of a purchase.
Test Result
R² value close to 1 confirms a strong linear relationship, validating the Alternative Hypothesis (H₁) hypothesis.
What it means
A positive correlation implies that longer browsing times lead to higher purchase likelihood. Customers who engage more with the website (spending more time browsing) are more likely to complete a purchase.
Next steps
Enhance Website Engagement: Implement personalized product recommendations, curated landing pages, and advanced search options to encourage longer browsing.
Improve Content Quality: Ensure product descriptions, reviews, and visuals captivate customer attention and keep them engaged.
Monitor and Optimize Engagement Metrics: Use A/B testing to evaluate the impact of design or content changes on browsing time and purchase likelihood.
Retarget Short-Session Users: Use marketing campaigns like email follow-ups or promotions to re-engage customers who browsed for a short duration but didn’t purchase.
Hypothesis 2
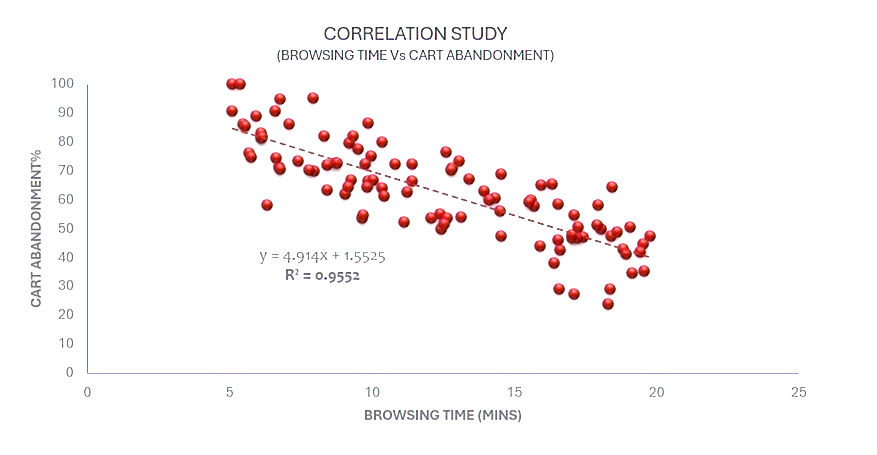
Null Hypothesis (H₀) is that there is no significant relationship between browsing time and cart abandonment. The alternative Hypothesis (H₁) is a significant negative relationship between browsing time and cart abandonment. Longer browsing times are associated with lower cart abandonment rates, while shorter browsing times are linked to higher cart abandonment rates.
Test Result :
Strong negative correlation, meaning longer browsing time reduces cart abandonment.Alternative hypothesis (H₁) is accepted.
What it means :
Shorter browsing sessions correlate with a higher likelihood of abandoning carts, indicating insufficient engagement or friction during the buying journey.
Next Steps :
Simplify Checkout Process
Streamline the checkout process to reduce friction, ensuring customers can easily complete their purchases.
Introduce Cart Recovery Strategies
Implement features like cart reminders, limited-time discounts, or free shipping incentives to reduce abandonment.
Personalize the Experience
Use data to personalize the cart and suggest complementary products, increasing the perceived value of completing the purchase.
Optimize Browsing Flow
Identify and eliminate barriers causing customers to abandon browsing prematurely, such as poor navigation or lack of product information.
Further to this, regional analysis is conducted to understand how cart abandonment and purchase likelihood vary across different geographic regions. By identifying high-abandonment or low-purchase regions, Amazon can pinpoint specific areas requiring targeted interventions, optimizing strategies to improve customer engagement and reduce lost revenue.


Using this regional analysis, Amazon can focus its efforts where they matter most—on regions with the highest cart abandonment or lowest purchase likelihood. This data-driven approach ensures that resources are allocated effectively, resulting in improved customer satisfaction, reduced revenue leakage, and higher conversions.
Integrating anticipatory shipping into Amazon’s logistics network required aligning warehousing, transportation, and delivery operations, along with training teams to handle rerouting and cancellations. The result was faster deliveries, often same-day, which boosted customer loyalty and repeat business. For Amazon, increased use of ground shipping reduced costs, while demand-based pre-positioning cut overstocking and waste, significantly improving efficiency. This efficiency wasn’t just operational—it was financial.
By 2022, Amazon’s annual revenue had skyrocketed to $524 billion, with anticipatory shipping playing a crucial role in sustaining that growth.
Amazon’s anticipatory shipping system is a masterclass in data-driven decision-making. It took the guesswork out of logistics and replaced it with precision, speed, and efficiency.
By predicting what customers wanted and getting it to them faster, Amazon didn’t just improve its operations—it redefined the standards for an entire industry. This bold approach to leveraging data solidified Amazon’s leadership in e-commerce and set a benchmark for what’s possible when technology, innovation, and customer focus come together. It’s a reminder that in today’s fast-paced world, success often hinges on how well a company can anticipate and meet its customers’ needs before they even realize them.
Target Canada: A $2 Billion Lesson in Ignoring the Data
In 2011, Target entered Canada with high expectations, acquiring 124 Zellers store leases and planning over 100 openings within two years. While the bold move aimed to dominate the market quickly, ignored data and warnings turned the expansion into a monumental retail failure.

One of the biggest issues was empty shelves caused by a poorly tested inventory system. Essentials like milk and diapers were often out of stock, while low-demand items like patio furniture overcrowded shelves in the wrong regions. With 70% of inventory data reportedly inaccurate, the supply chain chaos severely hurt customer experience and sales.
Customers visiting Target’s new stores were disappointed by higher-than-expected prices. A Deutsche Bank survey showed Target’s prices were only 19 cents cheaper than Walmart’s basket on average, with Walmart beating Target on 65% of popular items. This mismatch with Target’s U.S. reputation for affordability, combined with frequent stockouts, quickly eroded consumer trust and loyalty.
Target’s supply chain issues worsened with the rushed implementation of an untested warehouse management system. Poor training led to data entry errors and inventory tracking failures, causing products to be sent to the wrong stores or left idle in warehouses. Despite early warnings from internal teams, leadership underestimated the problem, allowing the chaos to escalate and frustrate both employees and customers.
Perhaps the biggest missed opportunity lay in understanding the Canadian market itself.
Pre-launch data showed that Canadian shoppers prioritized low prices, especially with Walmart’s strong presence. However, Target ignored this, replicating its U.S. model without adapting to local preferences.
This misstep alienated price-sensitive customers and gave competitors like Walmart and Costco an even stronger foothold. The financial consequences of ignoring these data points were staggering.
Within two years, Target Canada accumulated over $2 billion in losses. In early 2015, the company announced the closure of all 133 Canadian stores and laid off more than 17,000 employees.
What was meant to be a triumphant entry into a new market became a cautionary tale in retail expansion. The failure not only tarnished Target’s brand reputation but also highlighted how operational inefficiencies and a lack of market understanding can cripple even the most successful companies.
Looking back, the data was clear—warnings about inventory inaccuracies, supply chain bottlenecks, and pricing mismatches were all there. Yet, Target’s leadership pushed ahead with an overly aggressive rollout, underestimating the need to address these issues first. The rush to expand overshadowed the need for a stable operational foundation, leading to one of retail’s most notable failures.
For Target, what could have been a gateway to international success instead became a $2 billion lesson in the cost of overlooking the details.
The story of Target Canada is a reminder of the critical role data plays in decision-making. Every signal—whether it’s consumer preferences, pricing benchmarks, or supply chain performance—matters. Ignoring these signals in favor of aggressive timelines or assumptions about brand loyalty can lead to disastrous outcomes.
Whether it’s predicting demand, aligning operations, or understanding consumer behavior, data isn’t just an input; it’s the foundation of sustainable success. As businesses navigate increasingly complex markets, these case studies make one thing clear: the cost of ignoring data far outweighs the investment in understanding it.
Comments